Research in Safe Spaces
Case Study pt. III
10.18.21
HCD Collaborative Project - Case Study of Safe Spaces in Transportation for LBGTQ+ Students
As student researchers looking into what a safe space might feel like when transporting to and from campus, we looked into methods that would focus on students on campus. We wanted to get a direct look at what this community was already experiencing, how their experiences were successful, how they could be improved on, and how they could be applied to our research. The methods we used were Artifact Analysis, Focus Groups, Card Sorting, and Fly on the Wall. We gathered notes on all these methods and analyzed them to identify overlaps that would help us further understand the problem.
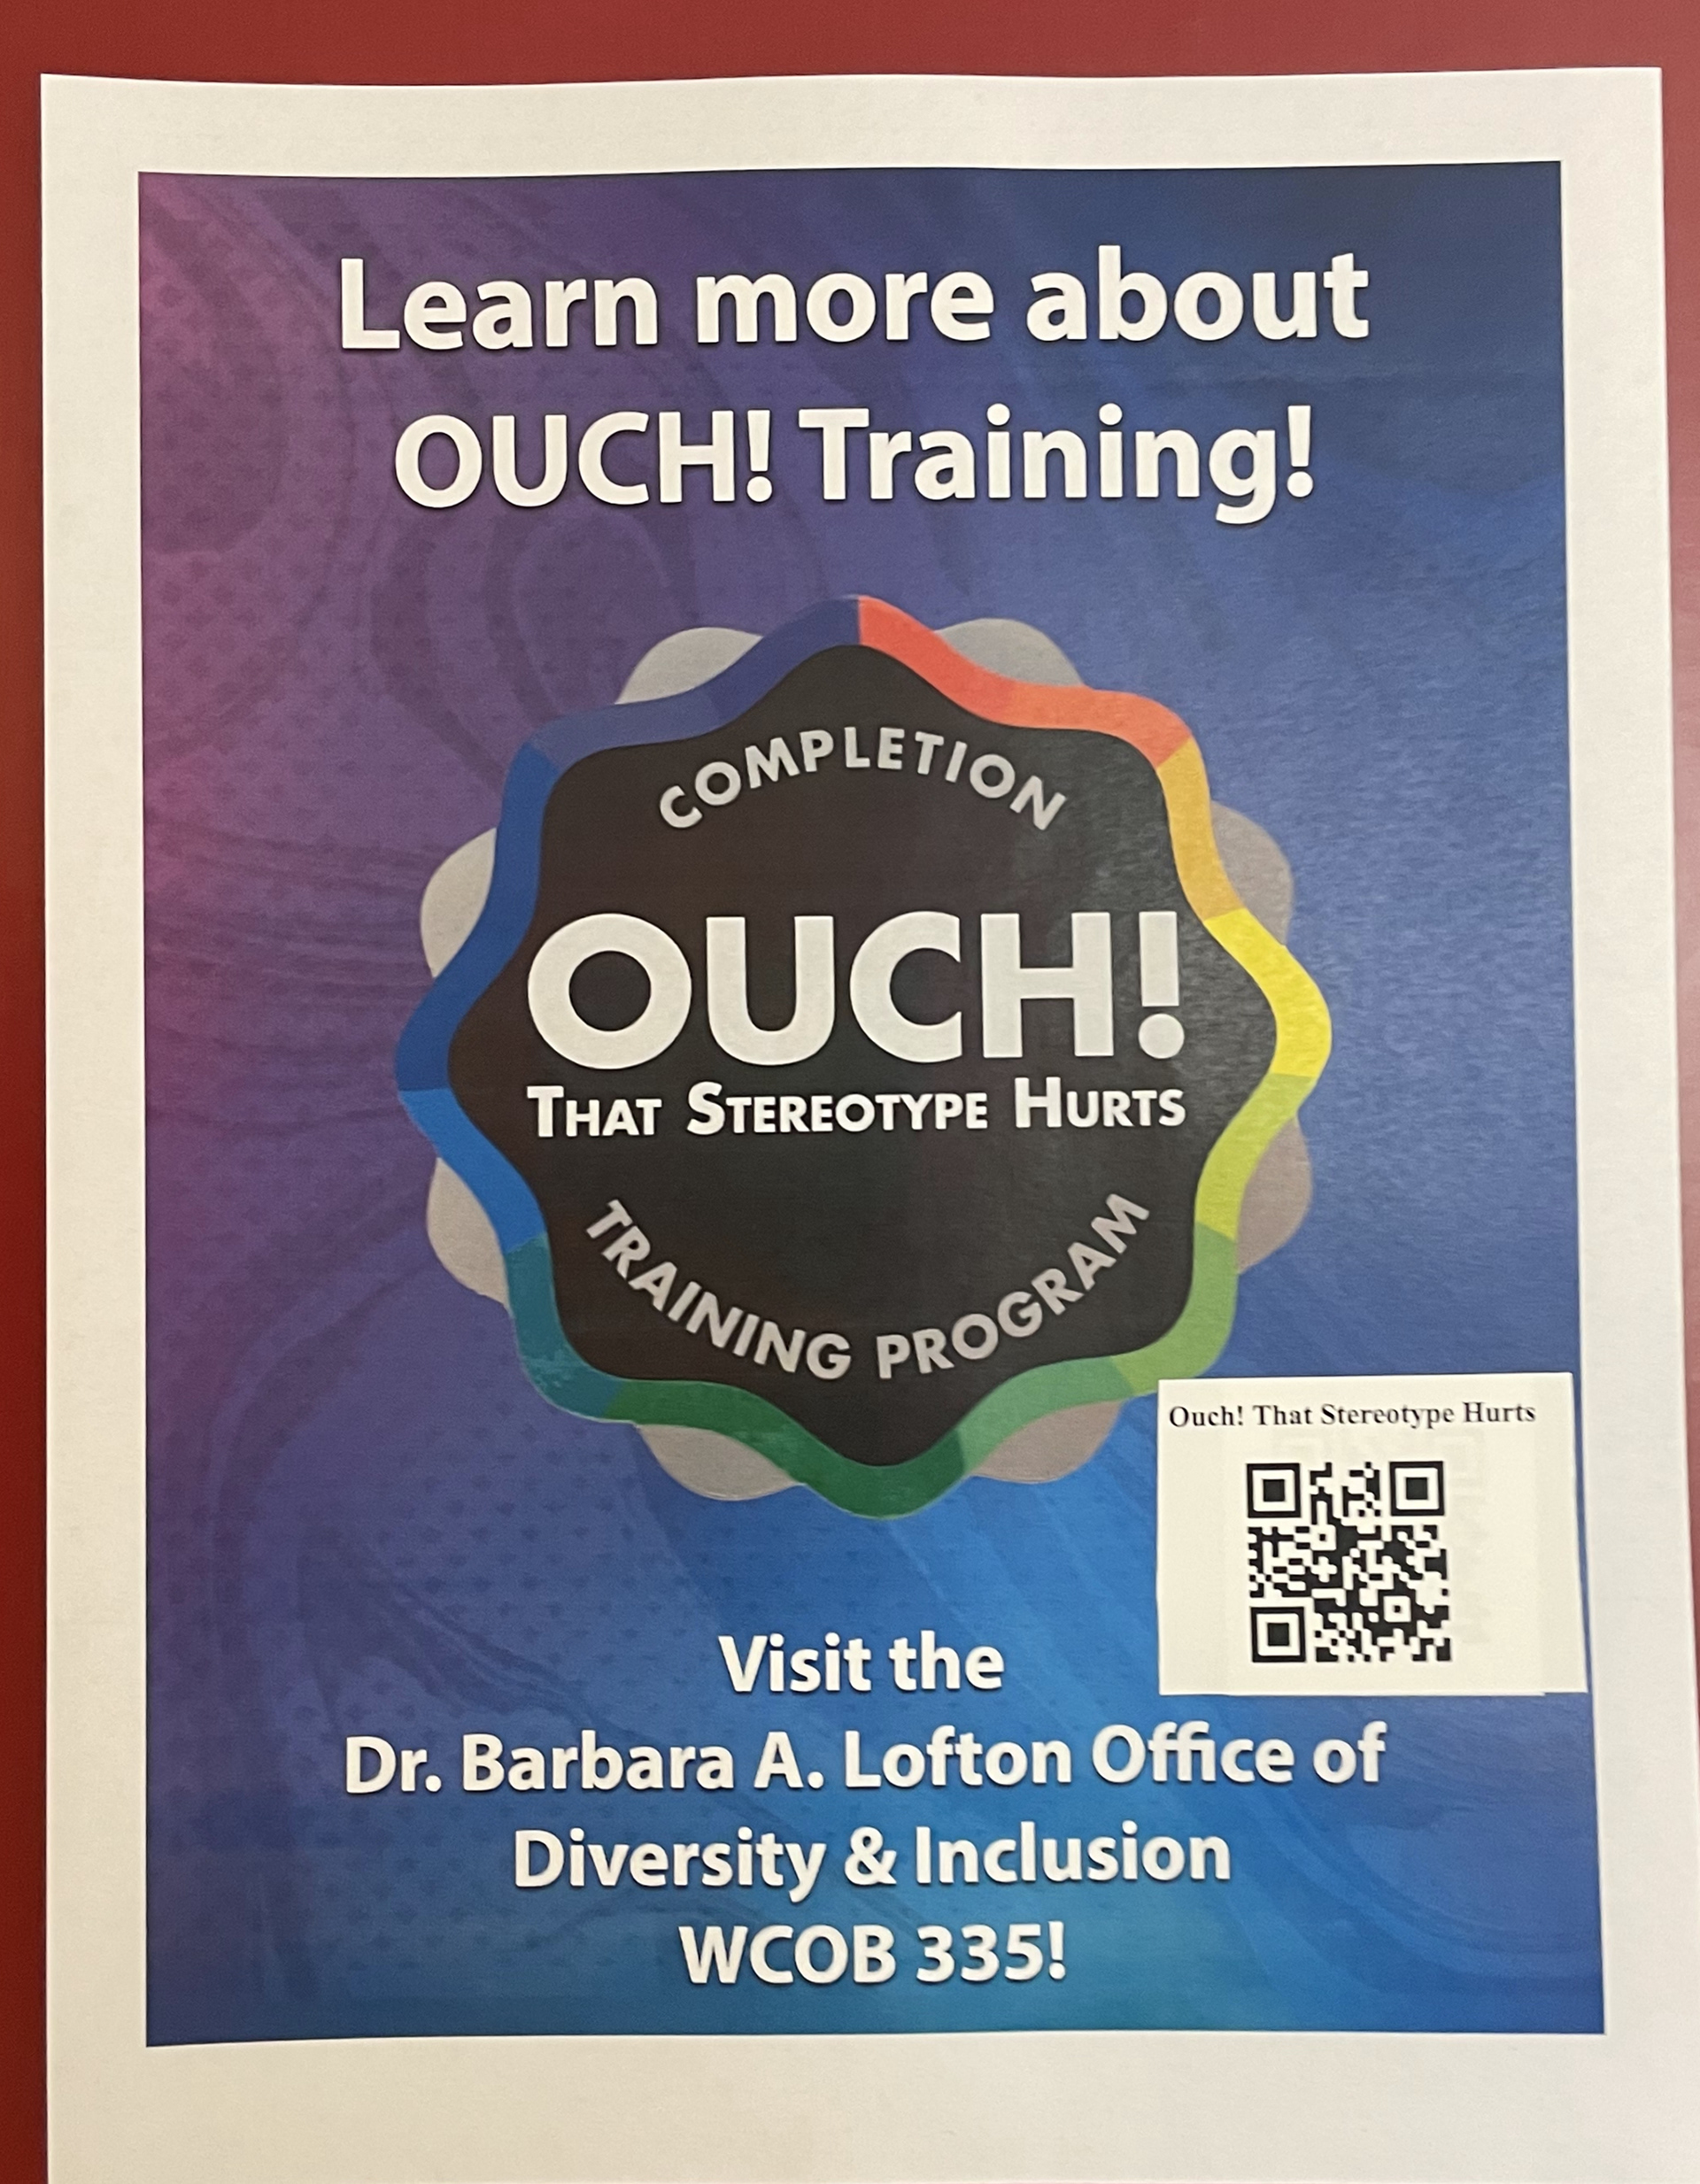
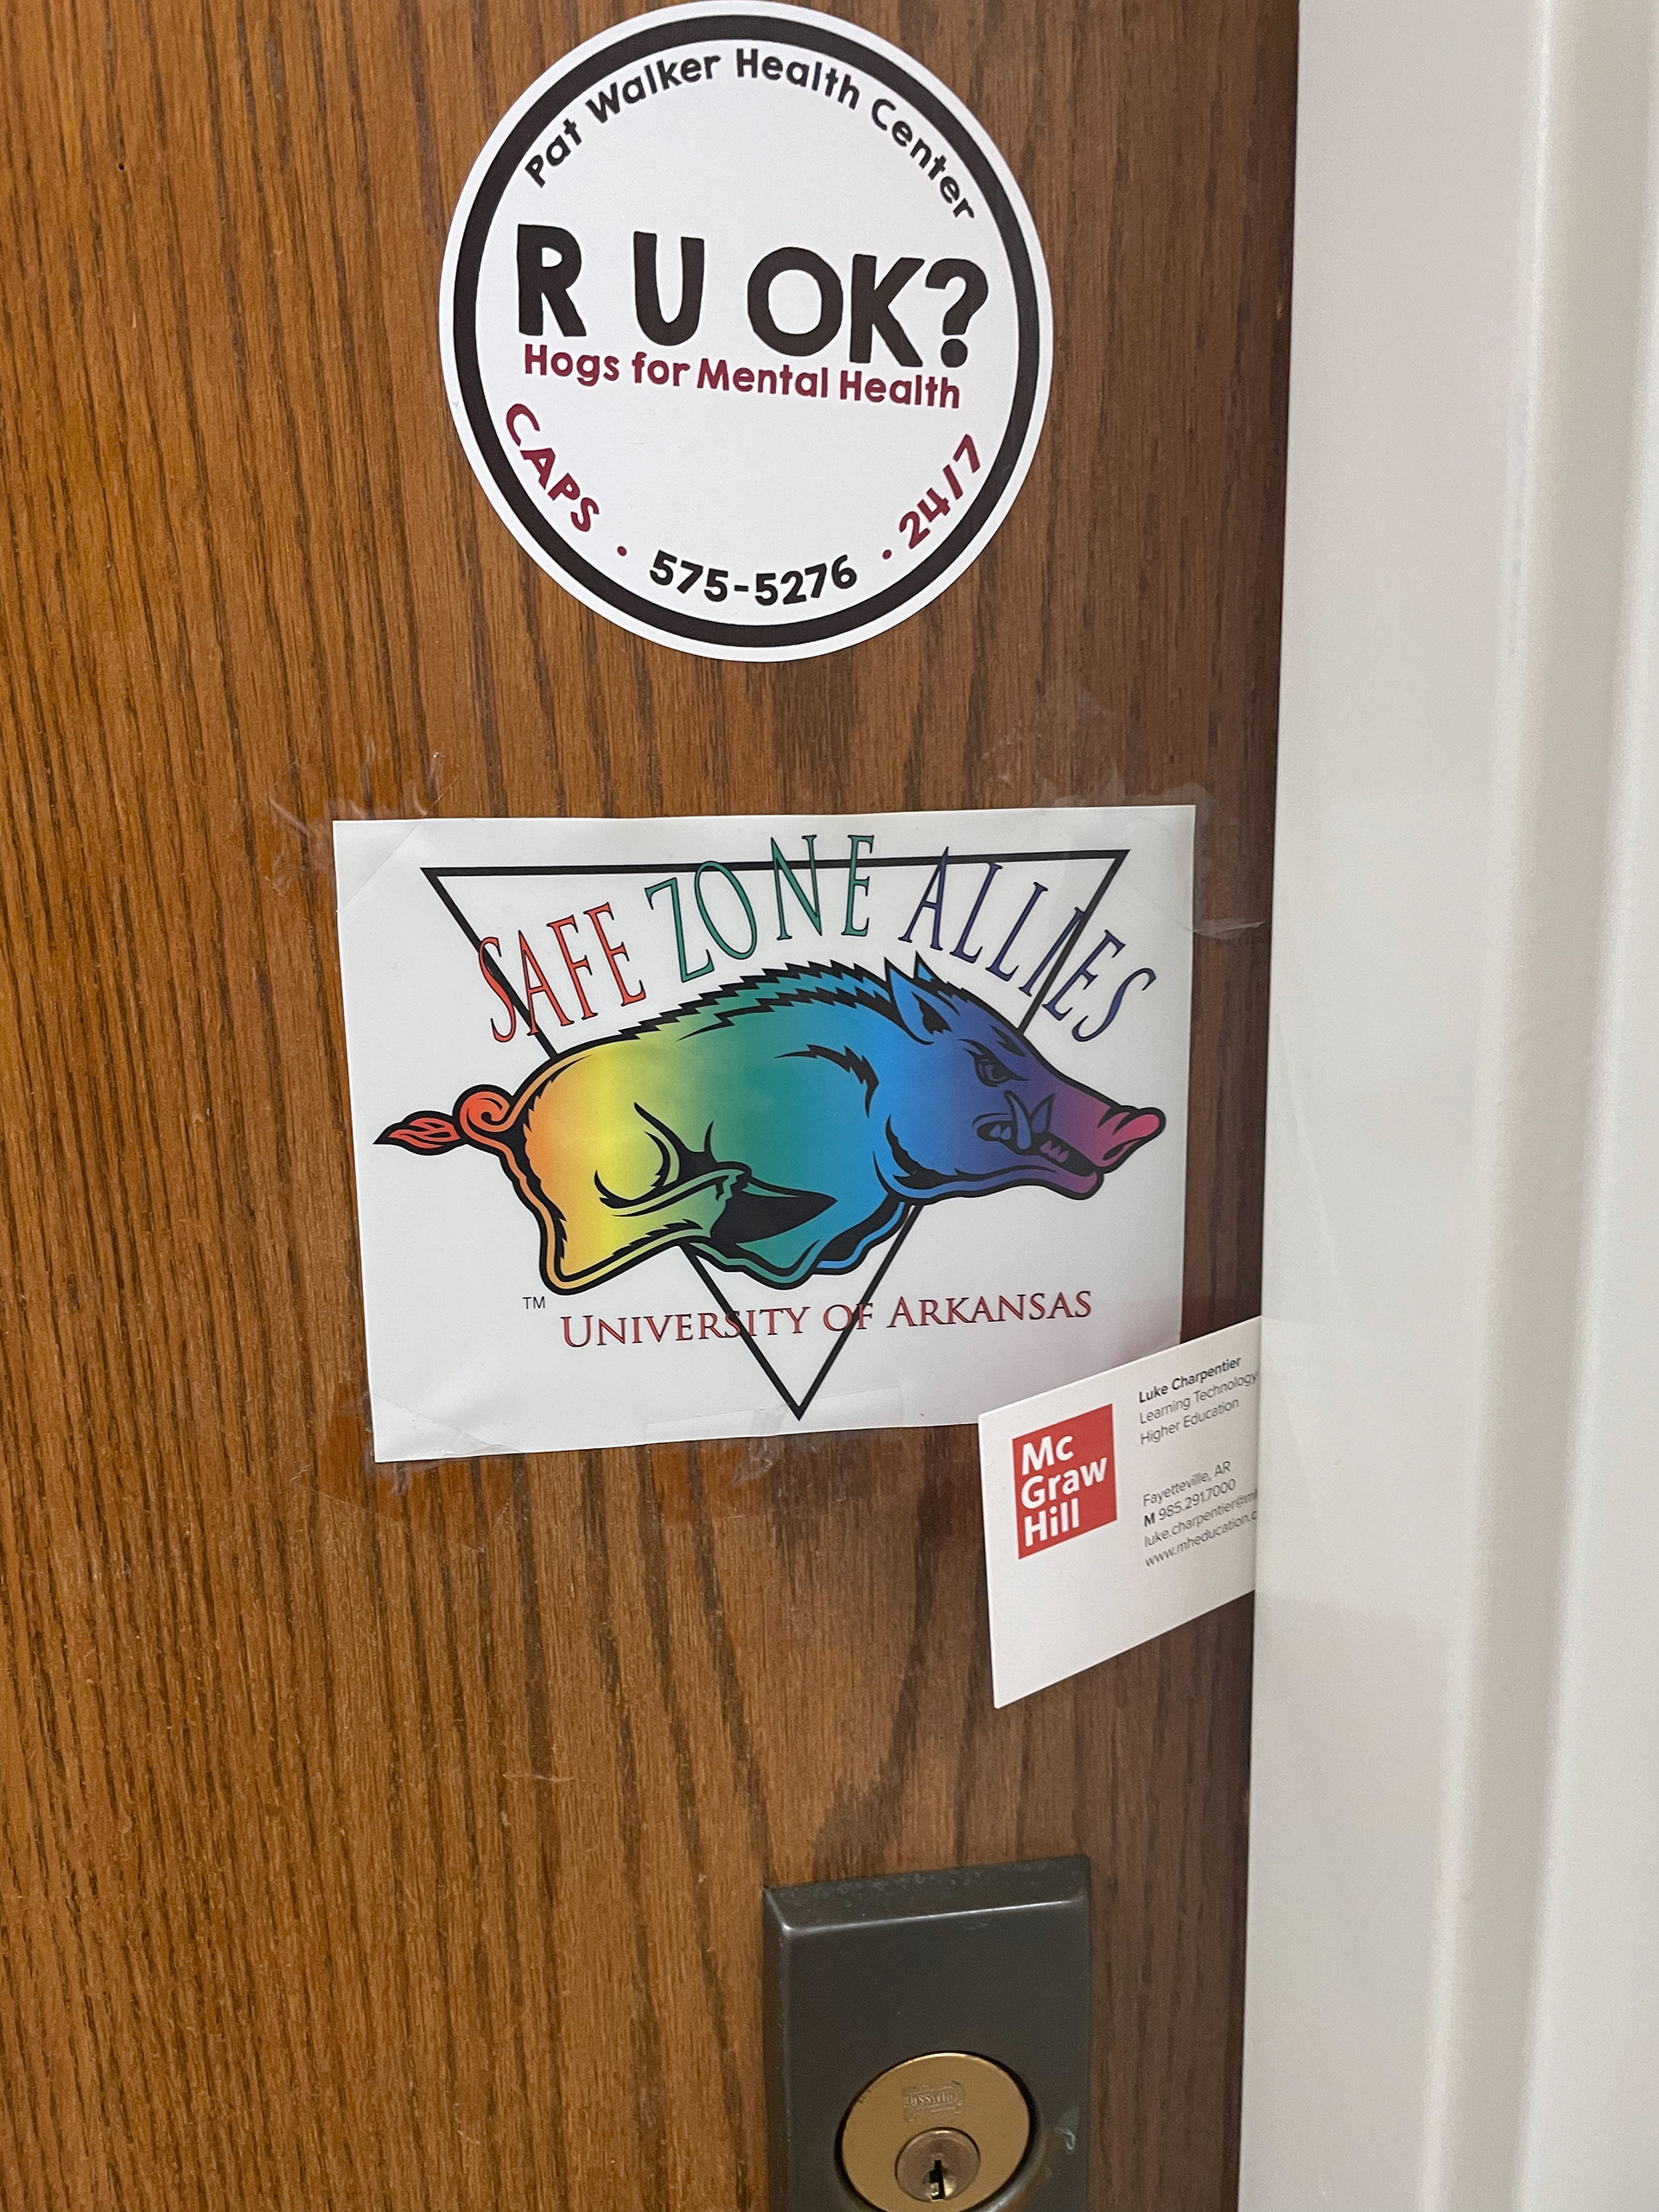
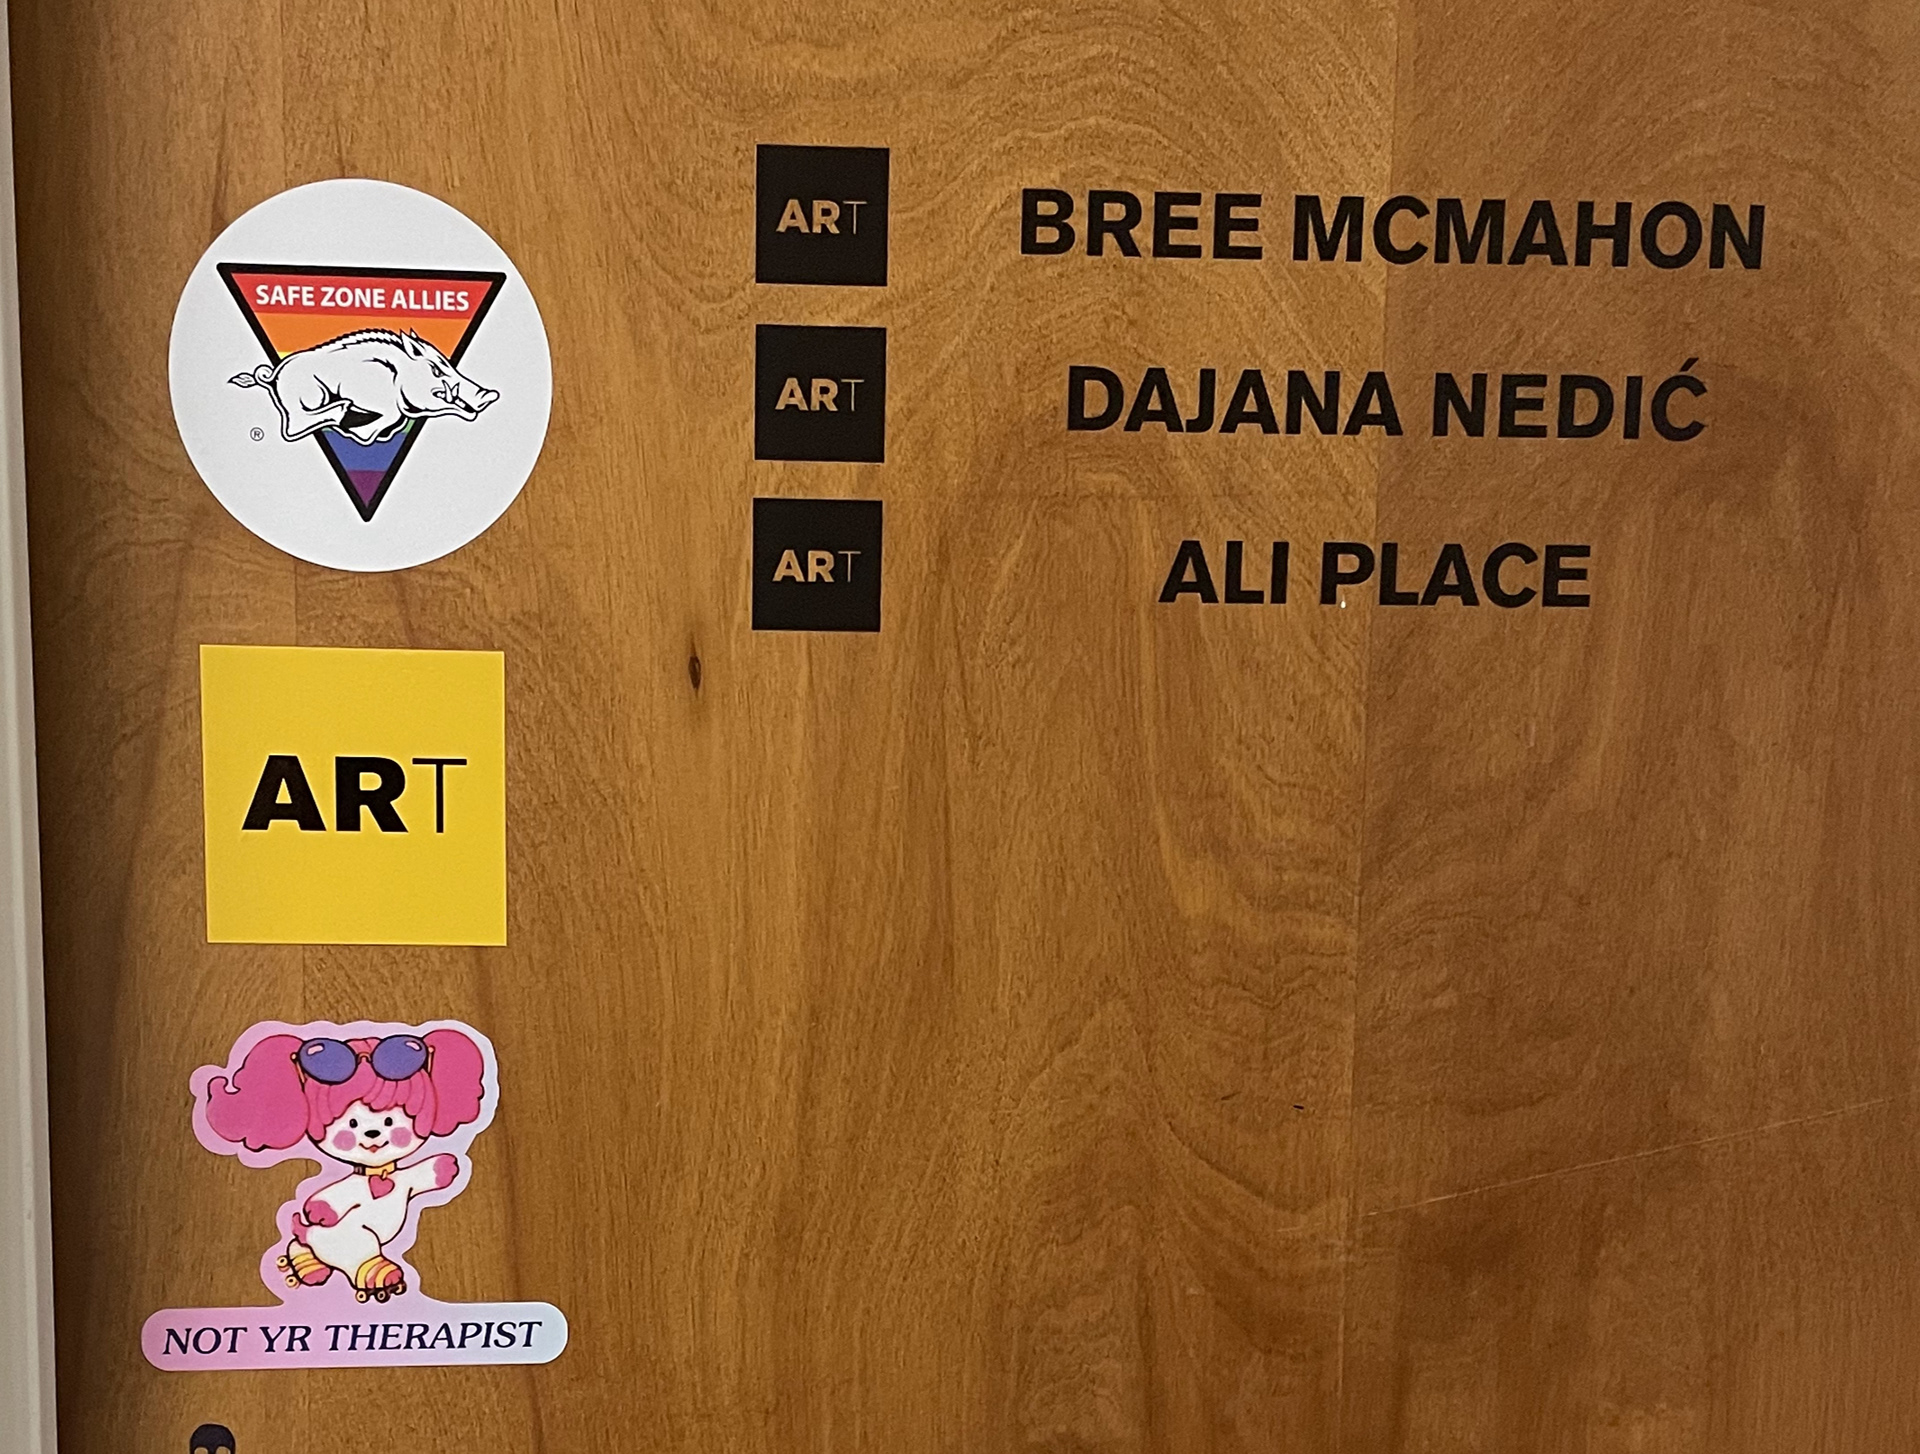
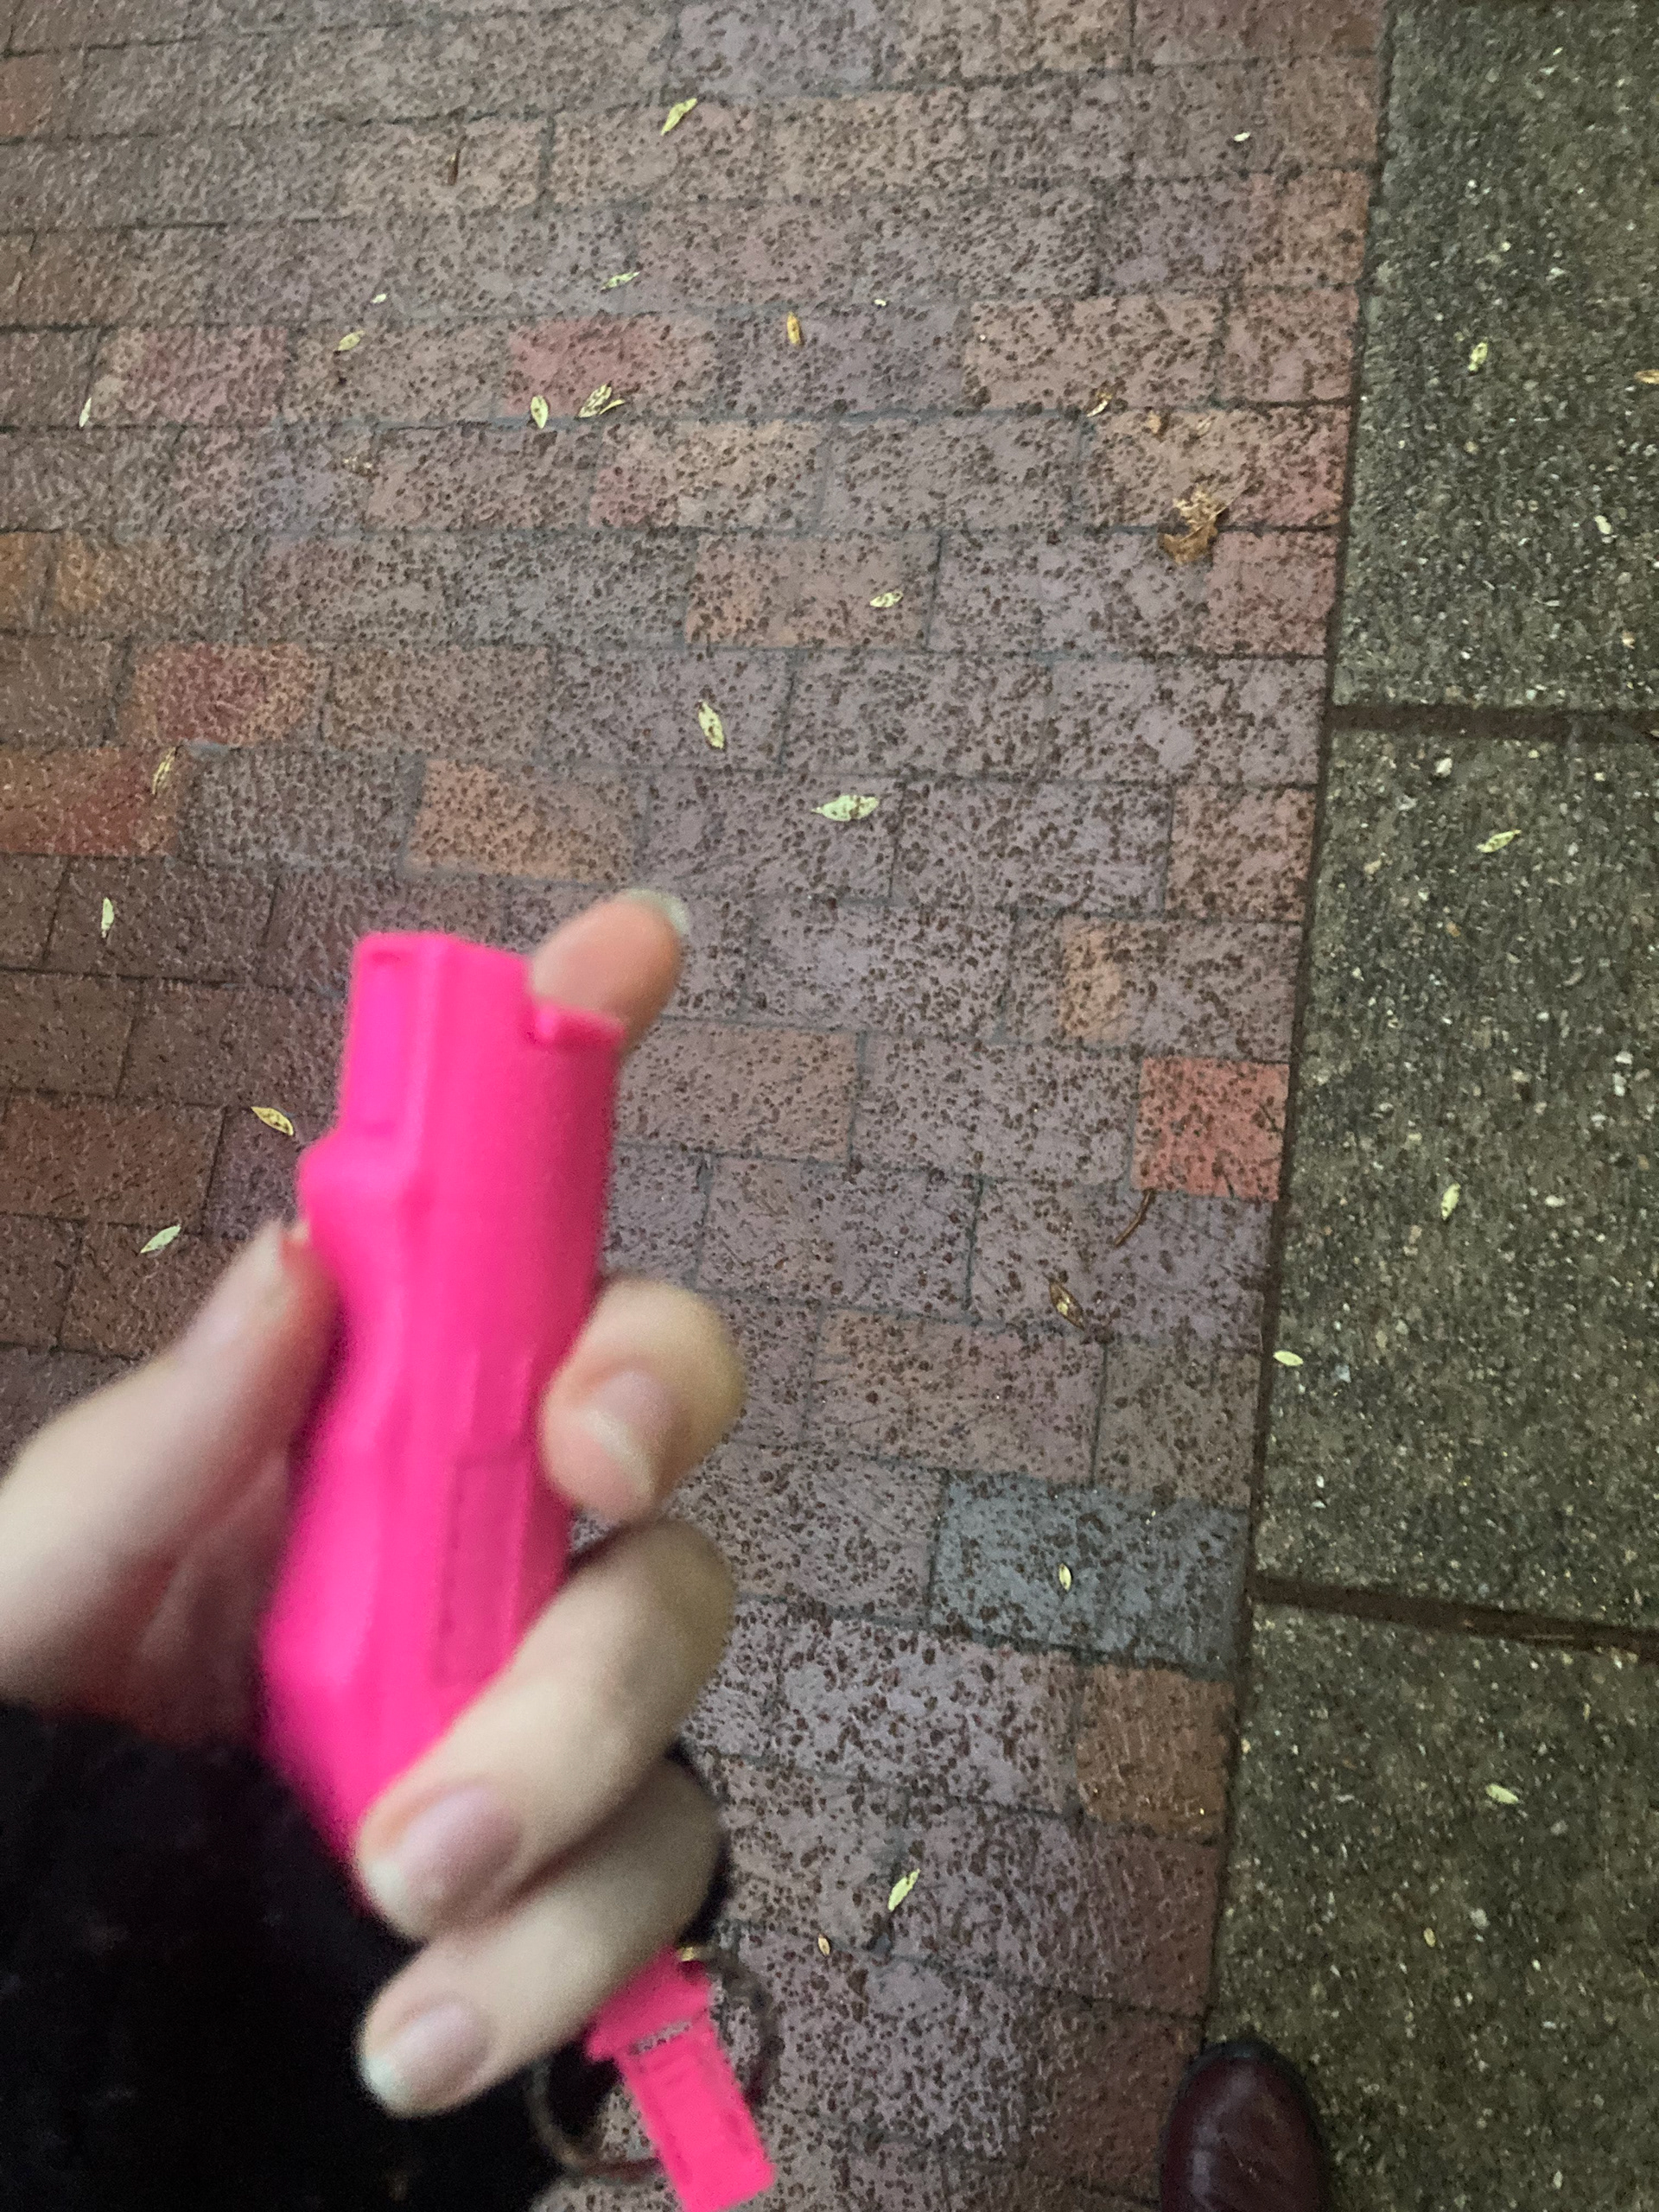
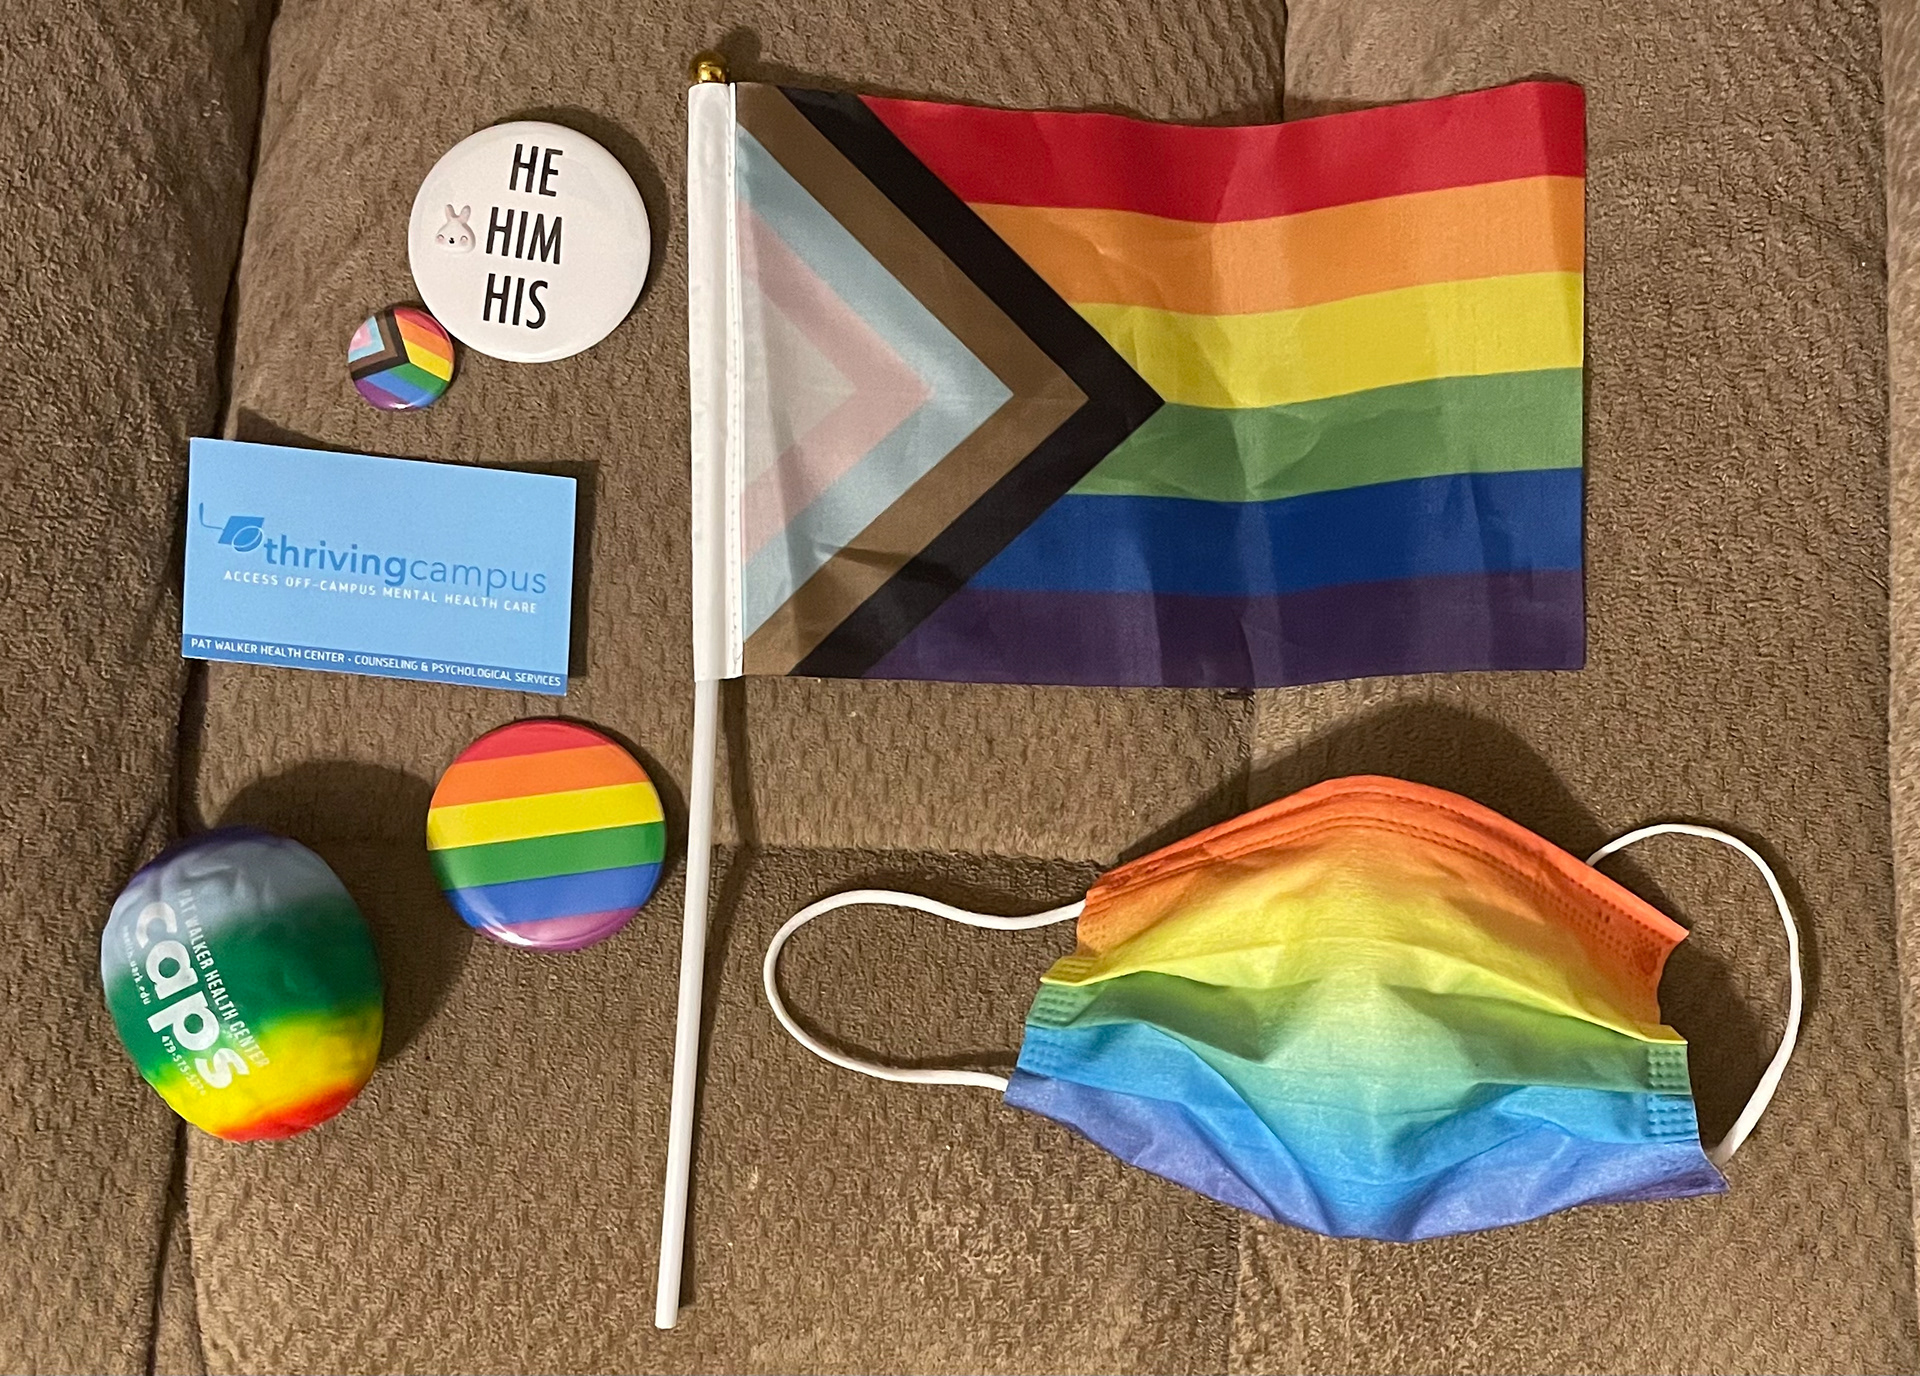
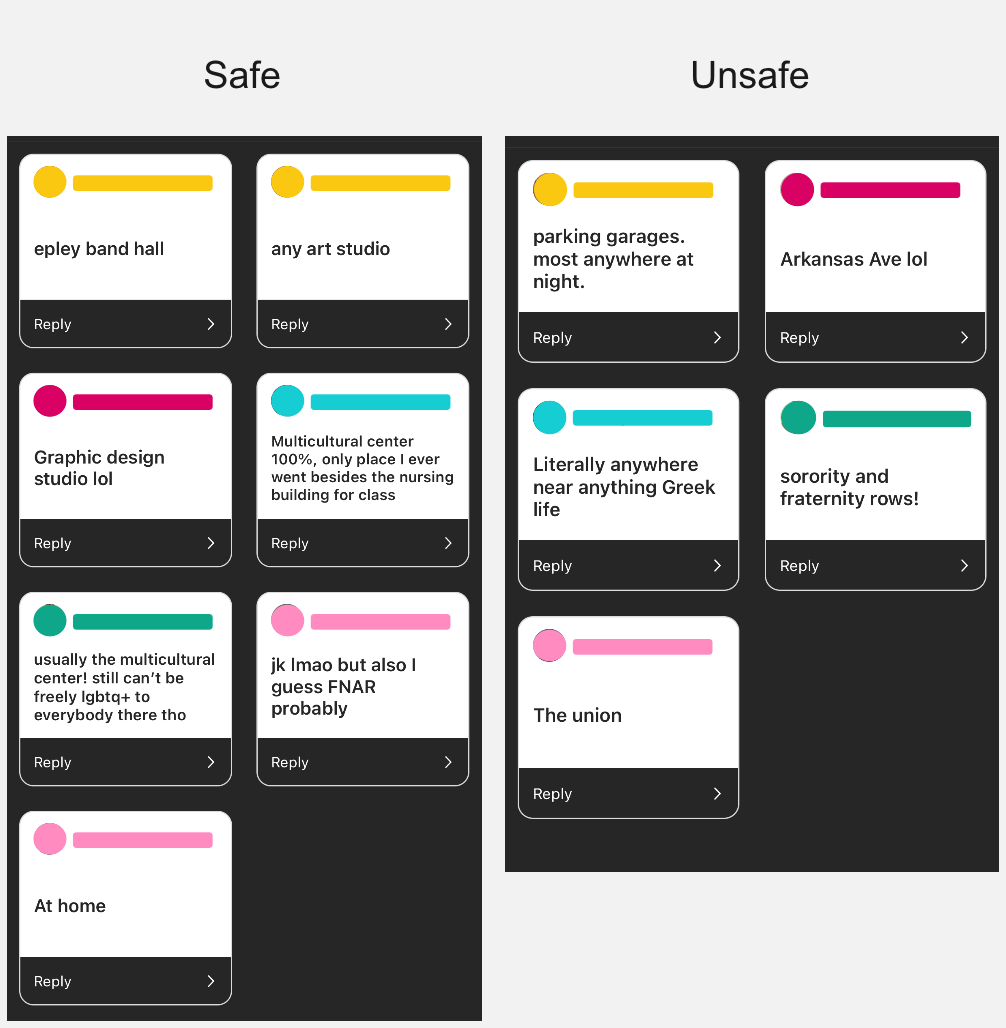
On the artifact analysis side of things, we found that most LGBTQ+-related stickers or other artifacts were on professors' doors. There were none that we found on basic doors, only on ones that would be office doors. We assumed there might be rules restricting the use of these stickers on classroom doors since different classrooms can be used by multiple professors. There were many professors' offices in the fine arts building that held statements of support on their doors, and while not all had the Safe Zone Allies stickers many still had some sort of support. Kimpel Hall professors had acceptance on only a few doors, notably in the foreign language departments. The business building had almost none, with one OUCH poster next to the Department of economics and management. There was nothing on or around the doors of the Diversity and Inclusion office, which was strange. From our photo studies, we also found people felt safe in big open spaces or places where they knew they would be safe and alone, that no one came into. Safety lights being broken made a place more unsafe than it would have been normally, and artifacts carried on a person were surprisingly little to none. One student said he had a stapler with him, but that’s the most he had for self-defense. Another student used bright, neon-pink pepper spray to keep them feeling safe, carrying it around on their keychain. Even the look of it shows attackers that they have pepper spray, and to back off, which is a deterrent. Most people didn’t bother carrying much for safety, and instead just walked where they felt was safest.
Focus groups were another way we found to understand our audience on a wider level. We wanted a way we could take a census with a wider group of people to discuss our topic in greater detail. Using this method, we wanted to gather a wider set of opinions about the reasons why they may or may not avoid public transportation as well as other issues like how LGBTQ+ inclusion would affect their current opinions. We also asked questions about what conditions would make the experience more pleasurable and other questions about improving the overall usability of public transport on and around campus. Our focus group research method summarized that most people would utilize public transit more frequently if public transit information was made more accessible and if the environment allowed for more inclusion of LGBT people, whether that be through more LGBTQ+ employees, or specific iconography.
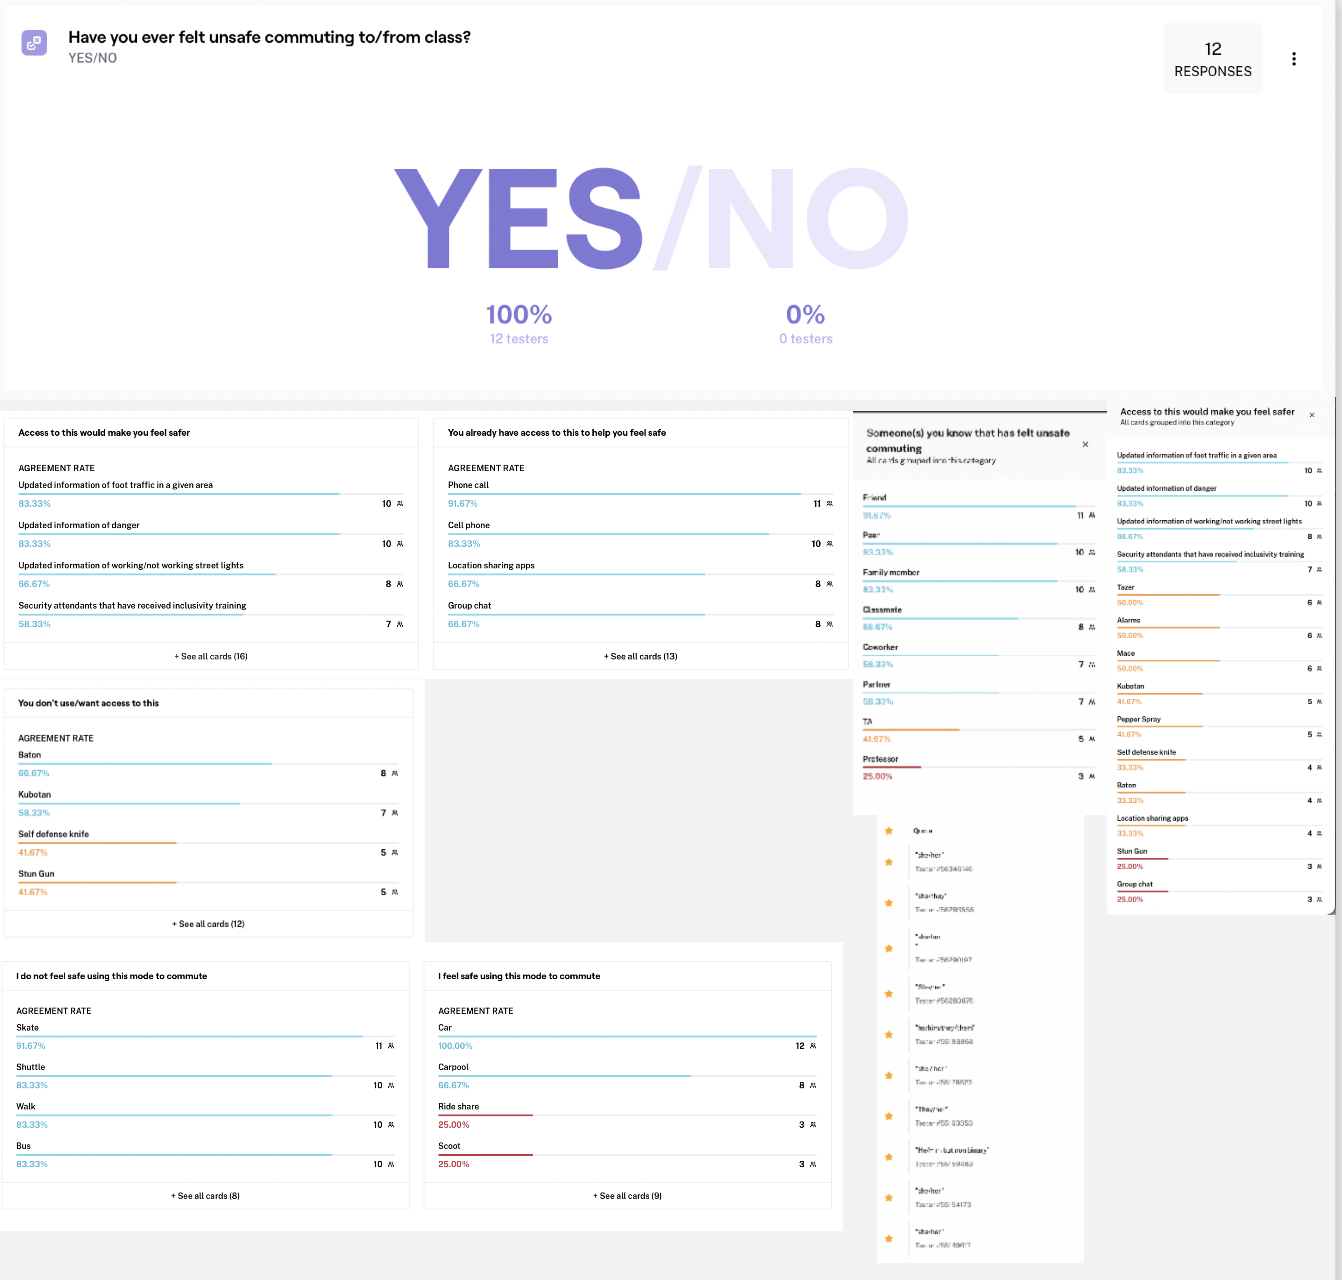
Card sorting has been a great way to understand what our potential users prioritize and find most useful. It provides objective results because it avoids assumptions. We cast a wide net to try to understand if users prioritize knowledge or physical protection the most. The card sorting method showed it was significantly overwhelming that users would love as much information as possible. It helped to understand what users would want and not what they think of other companies or products.
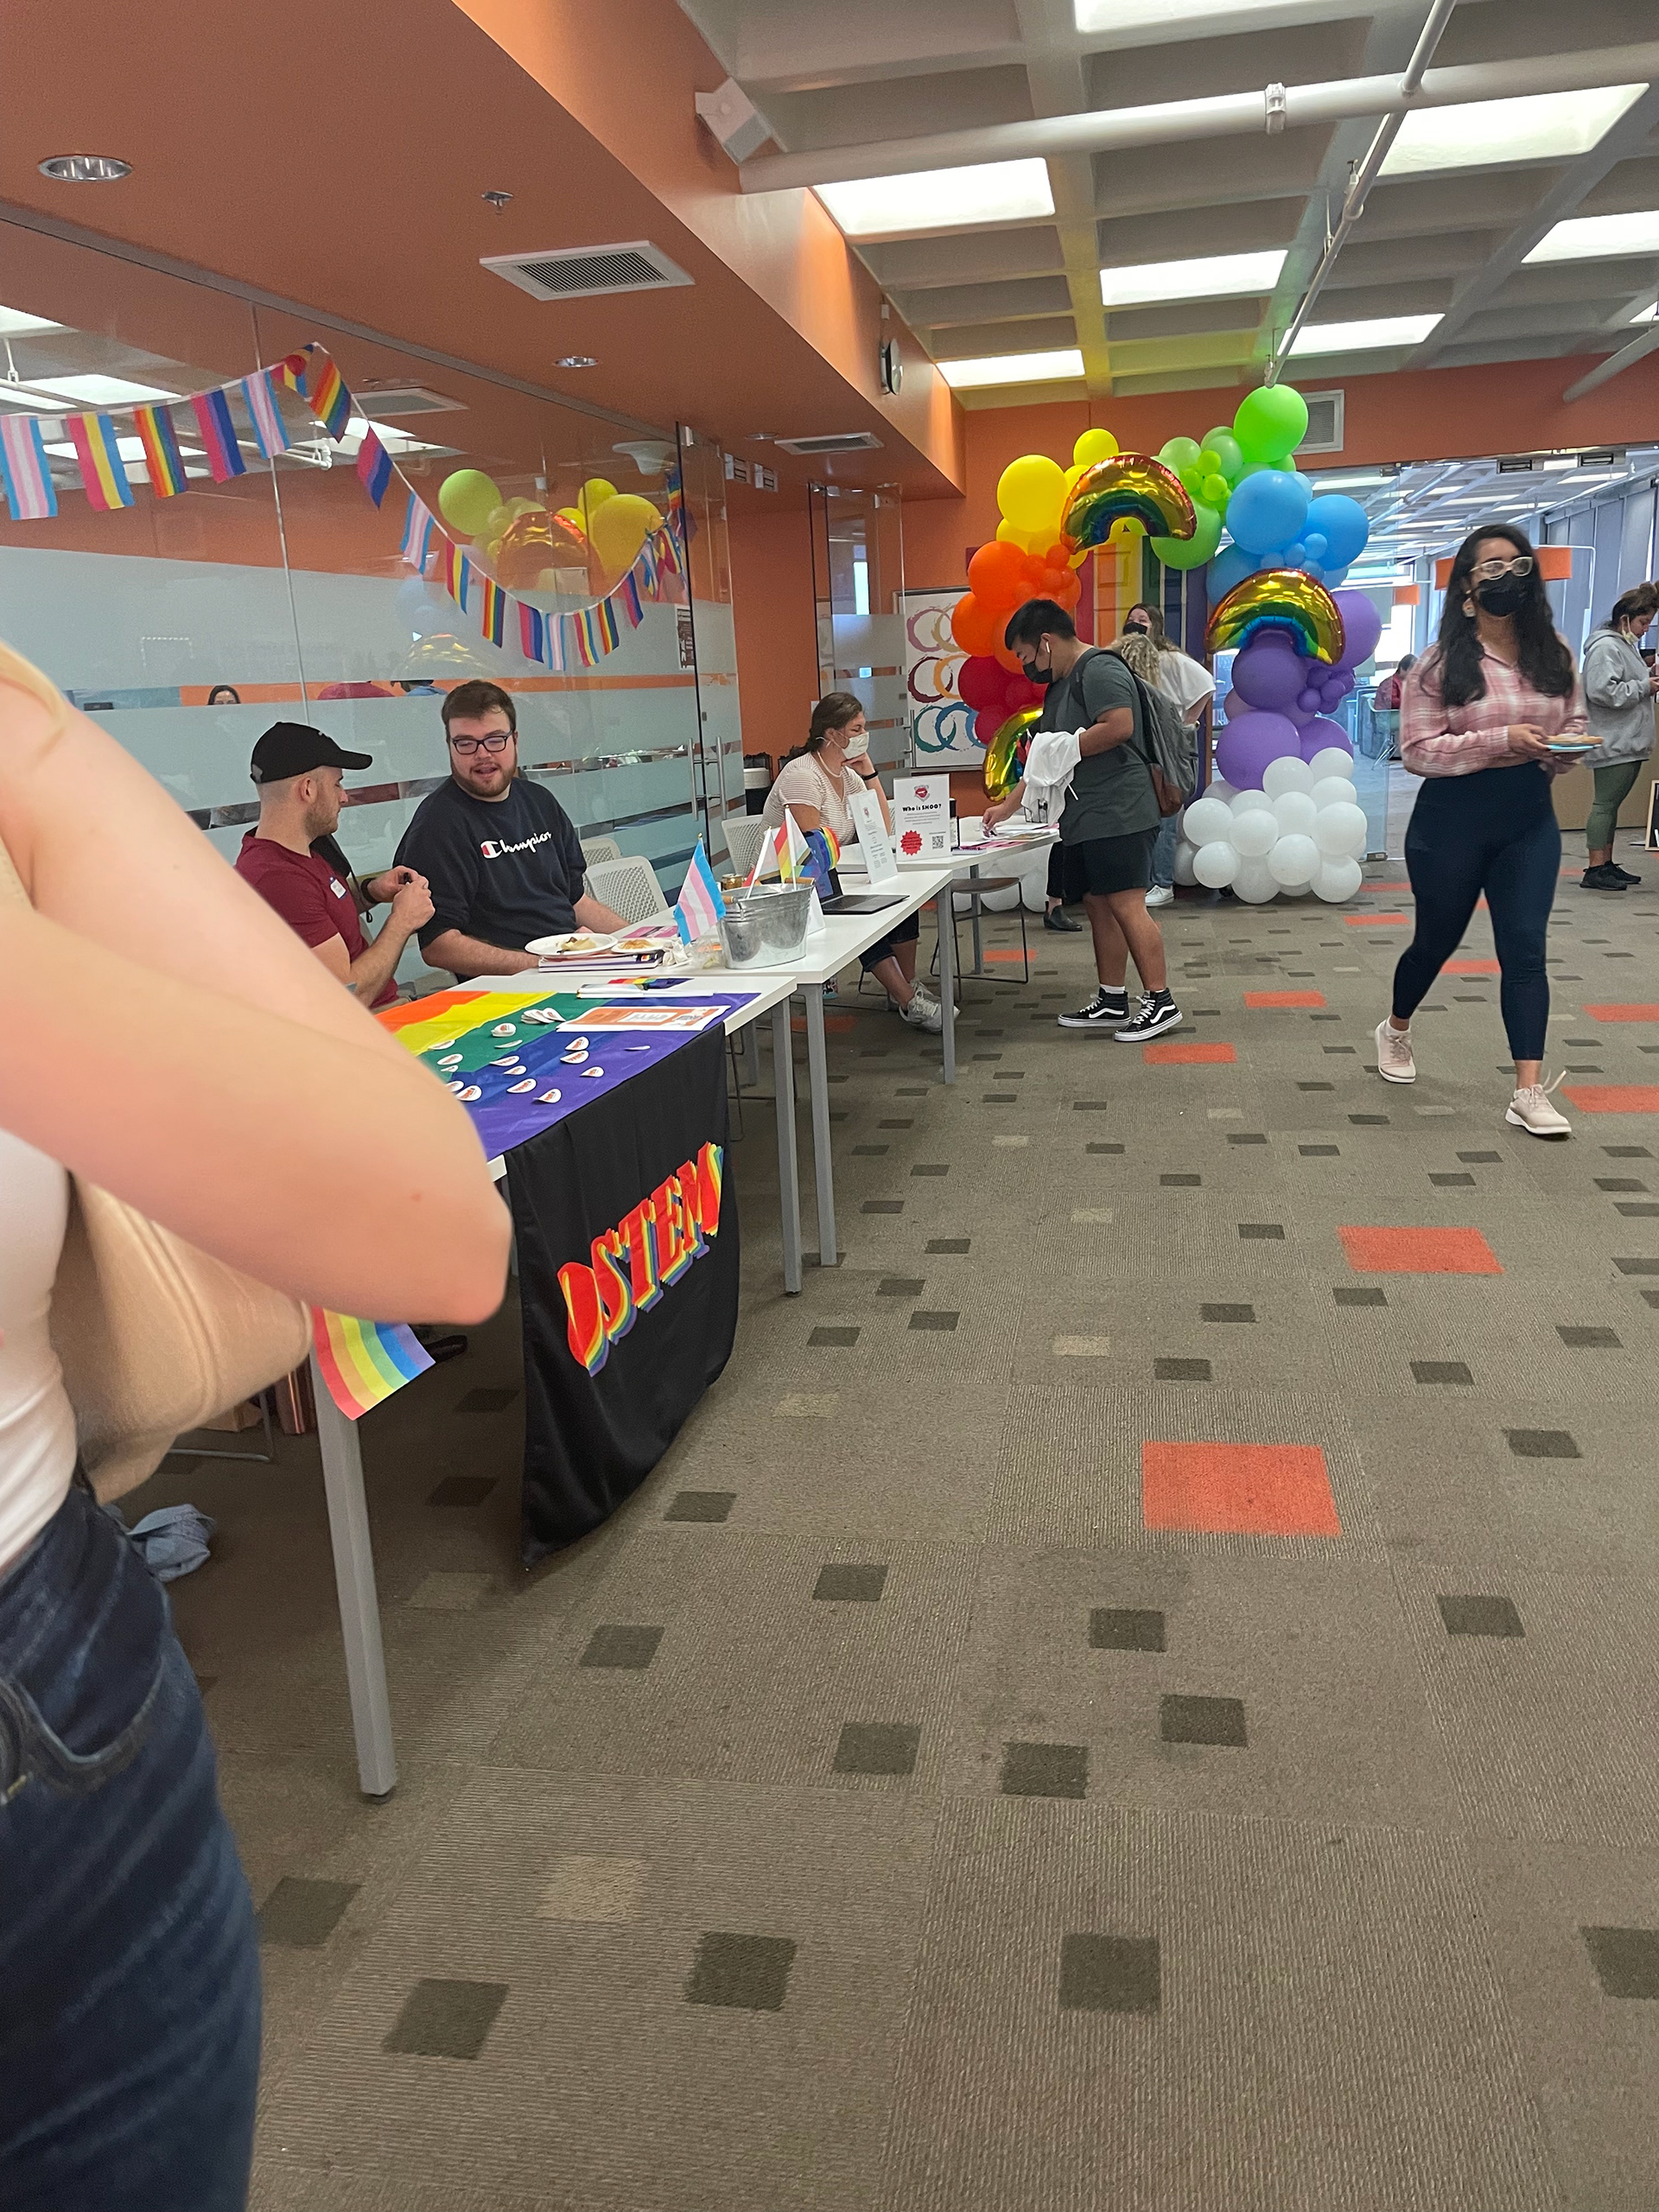
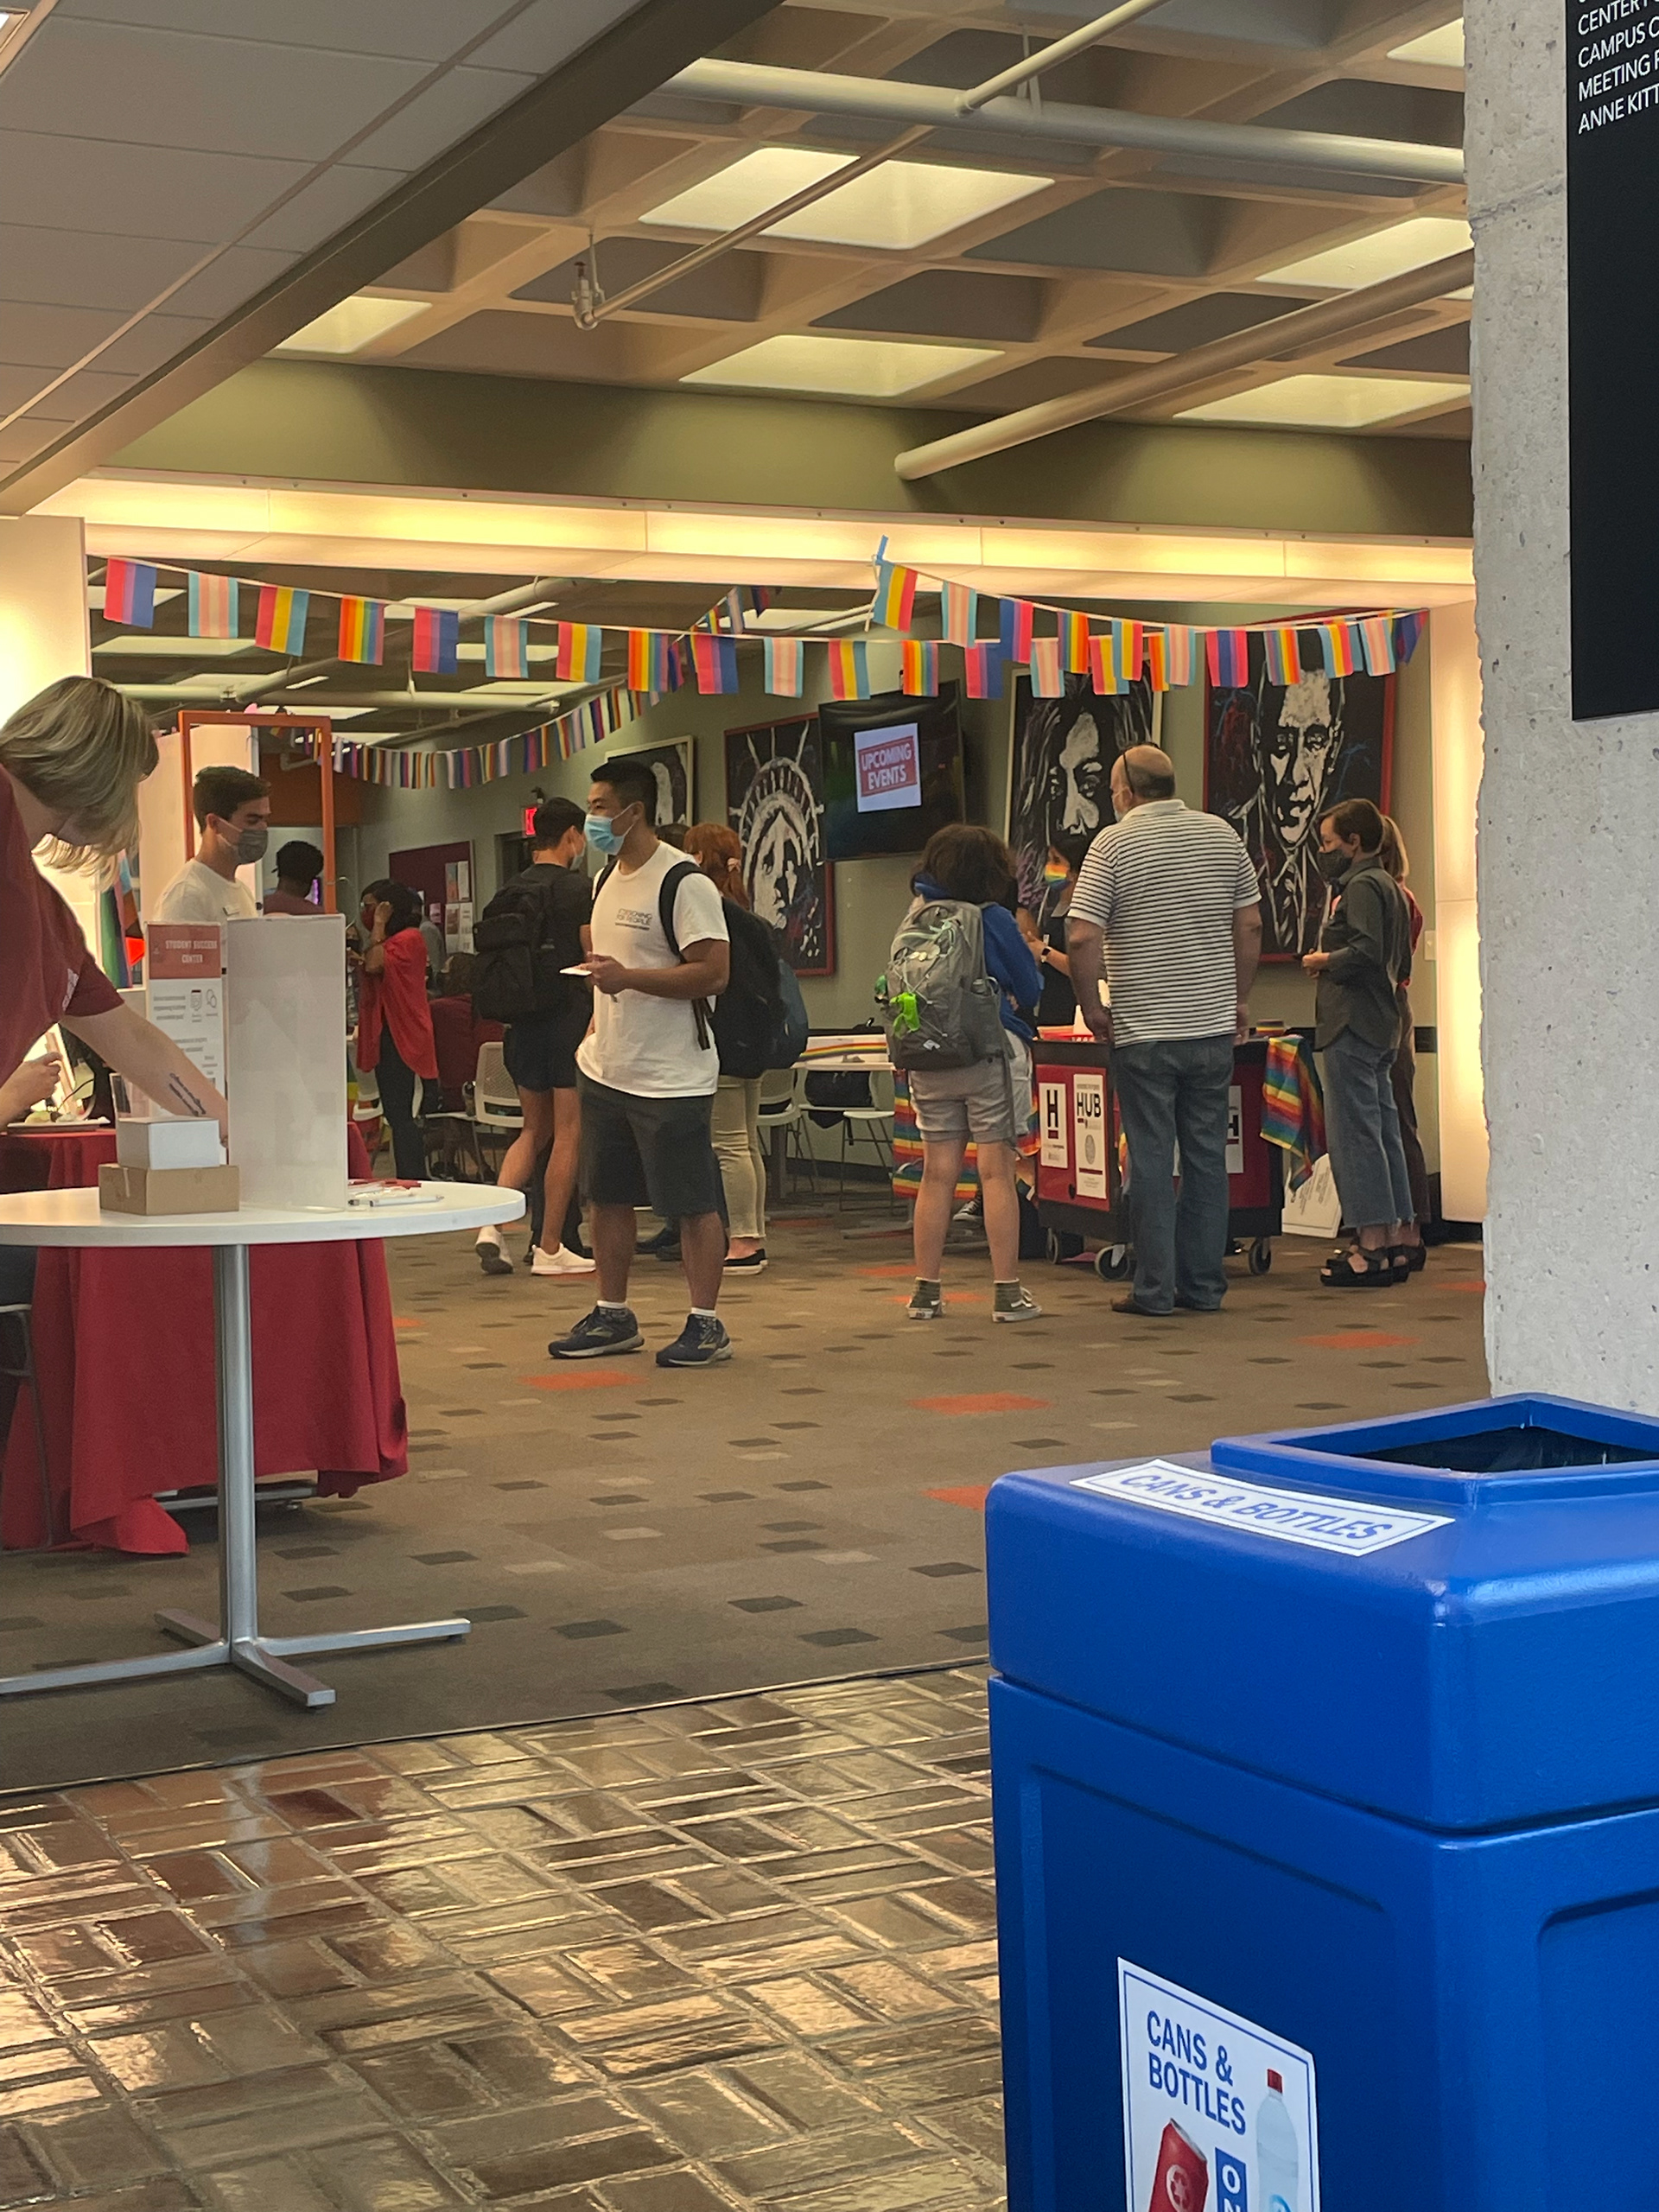
The fly on the wall method was conducted specifically at an LQBTQ+ fair to observe what a safe space would look like. Like flies on the wall, we were only allowed to observe from a distance rather than immerse ourselves in the experience. This temporary environment was near the multicultural center in our campus Union building. This fair was two hours long and around lunchtime so students would have time to visit. At the fair people from different departments, including the Law department and the Counseling department, had information about how they were inclusive, why they were trustworthy, and they would be there for the LGBTQ+ community. They made the environment feel safe and free by having smiles everywhere, playing fun music, sharing encouraging thoughts and compliments, having assuring words around, having inclusive iconography, and having a welcoming mentality. Their job was to create a space where newcomers would feel welcomed and current members would still feel safe enough to return. Overall it seemed like they accomplished their goal because no one seemed uncomfortable. Even people that attended alone looked like they felt secure.
From all our methods we discovered some overlaps we wanted to focus on. The overlaps in safe spaces included having inclusive iconography, having adequate lighting, and having access to information. Outside of tangibility, there was one crucial element to a safe space: trust. Most already existing places of safety had a trustworthy relationship with each individual that was built up over time. This is the same result we received from our interviews. People reported that usually if they felt comfortable in a space, it was either because they have been visiting it for a long time and have formed that trust, or they have observed the surroundings and based on the visual information they form trust, or they enter the space with a group of people that they trust and it makes them feel more comfortable about it. From this, we have learned that safe spaces can take a while before they feel safe and that they must have both tangible and intangible elements that work together to create security.
From all our methods we discovered some overlaps we wanted to focus on. The overlaps in safe spaces included having inclusive iconography, having adequate lighting, and having access to information. Outside of tangibility, there was one crucial element to a safe space: trust. Most already existing places of safety had a trustworthy relationship with each individual that was built up over time. This is the same result we received from our interviews. People reported that usually if they felt comfortable in a space, it was either because they have been visiting it for a long time and have formed that trust, or they have observed the surroundings and based on the visual information they form trust, or they enter the space with a group of people that they trust and it makes them feel more comfortable about it. From this, we have learned that safe spaces can take a while before they feel safe and that they must have both tangible and intangible elements that work together to create security.
Gallery
